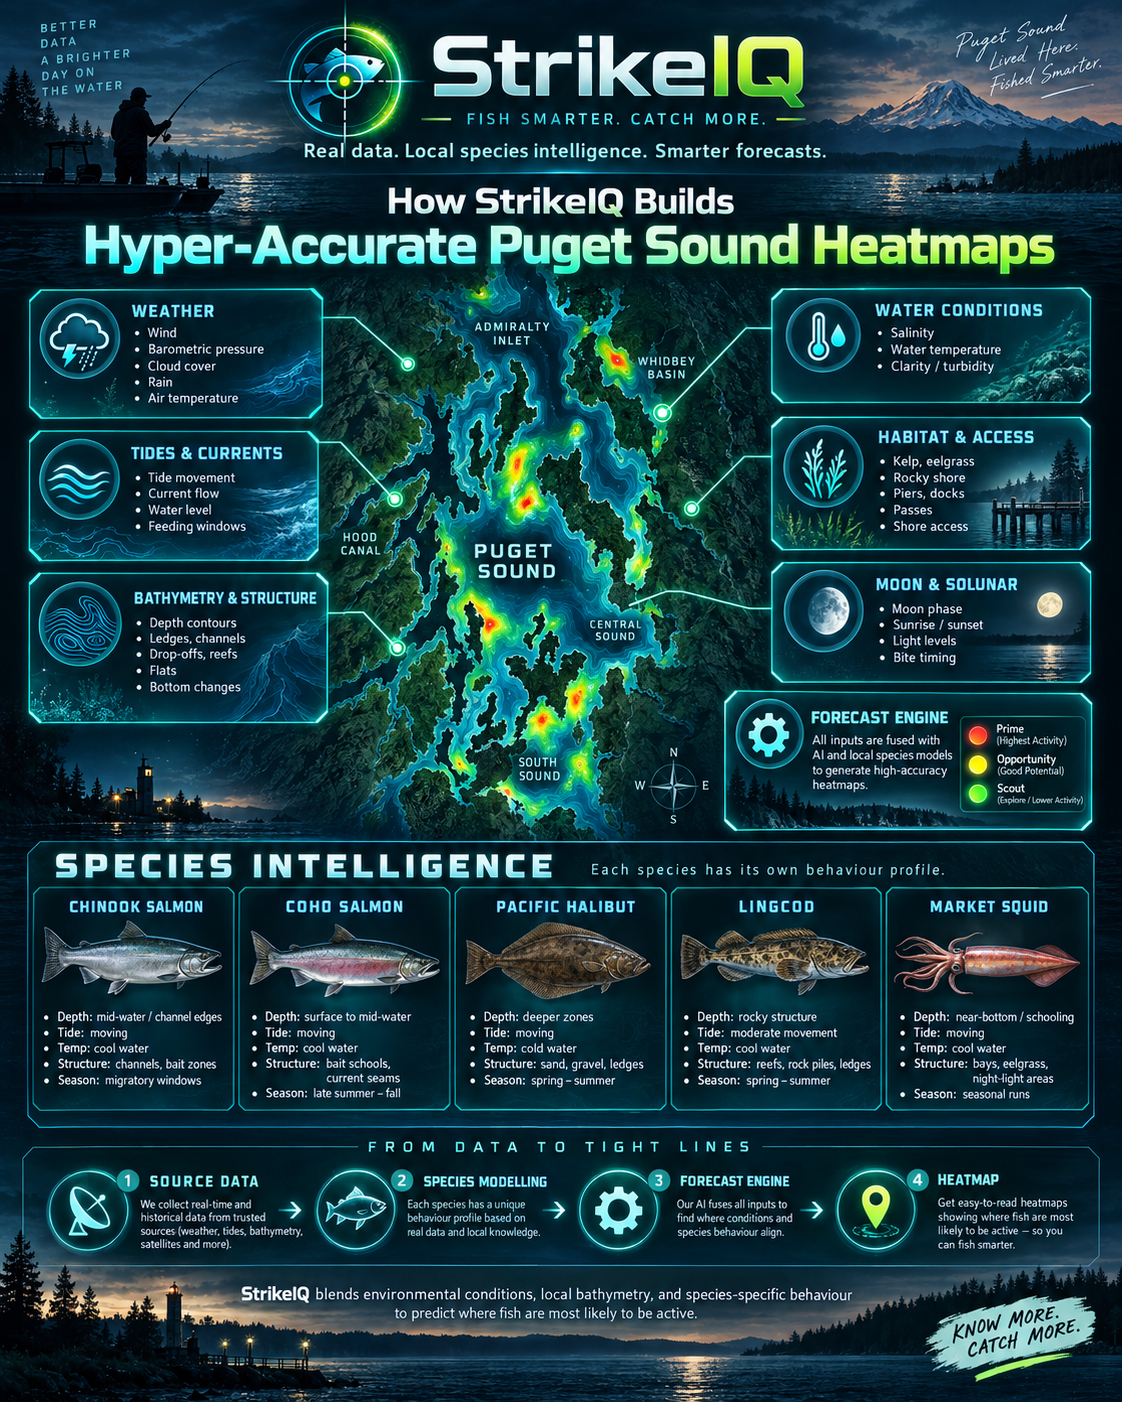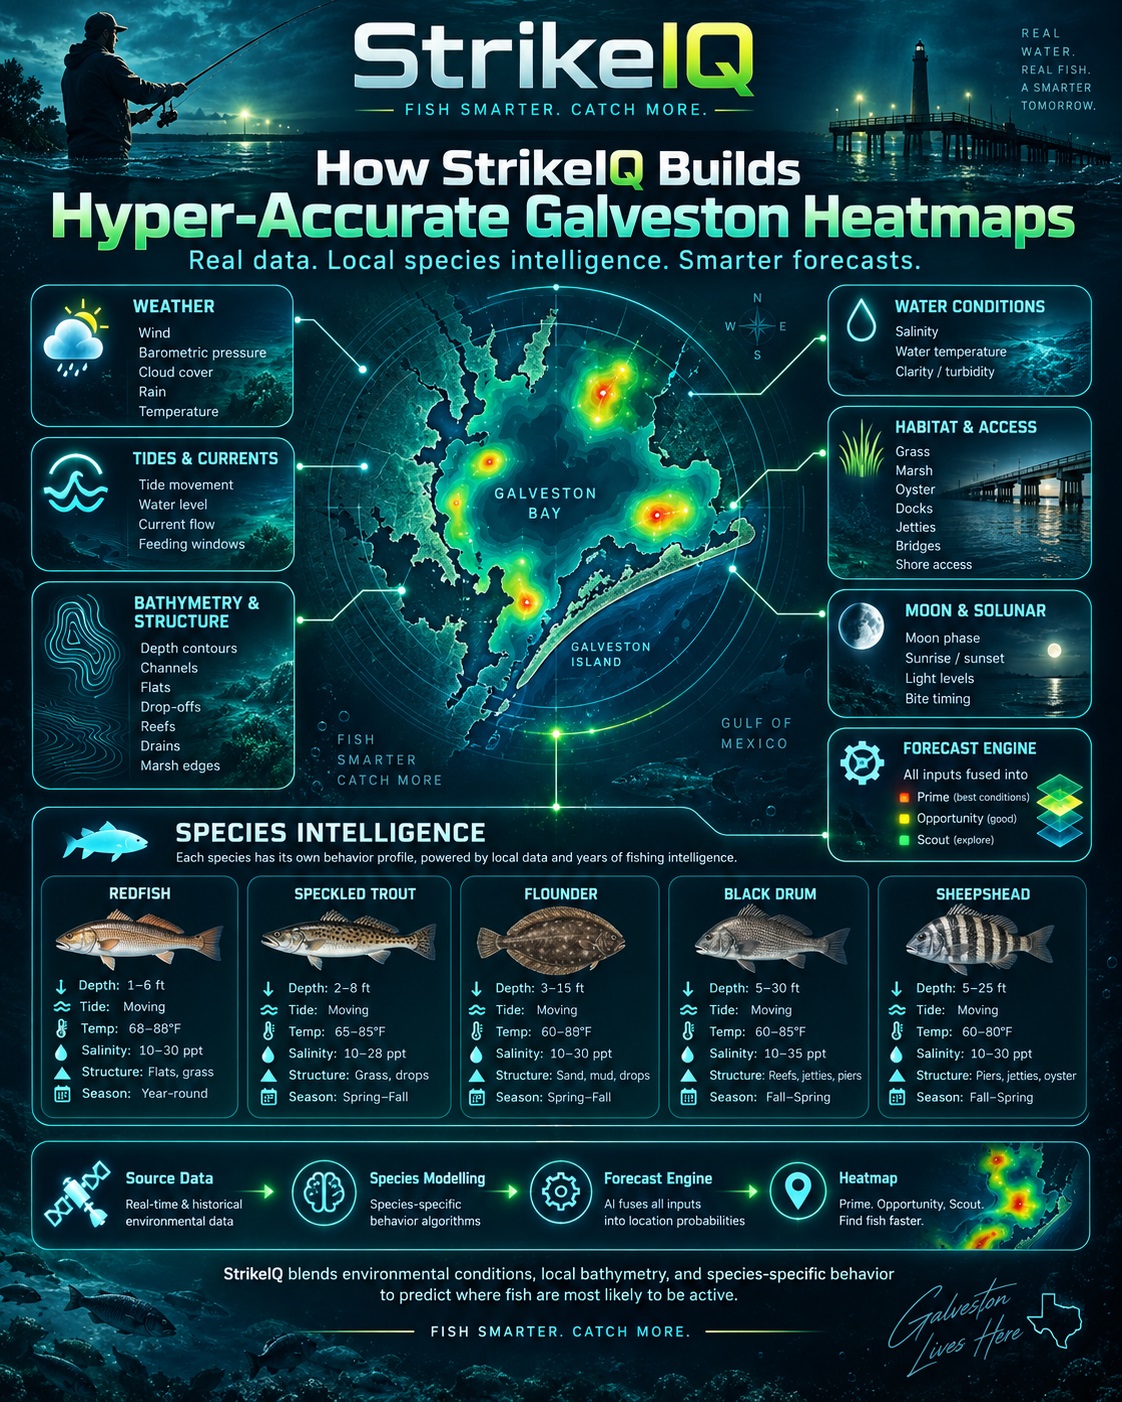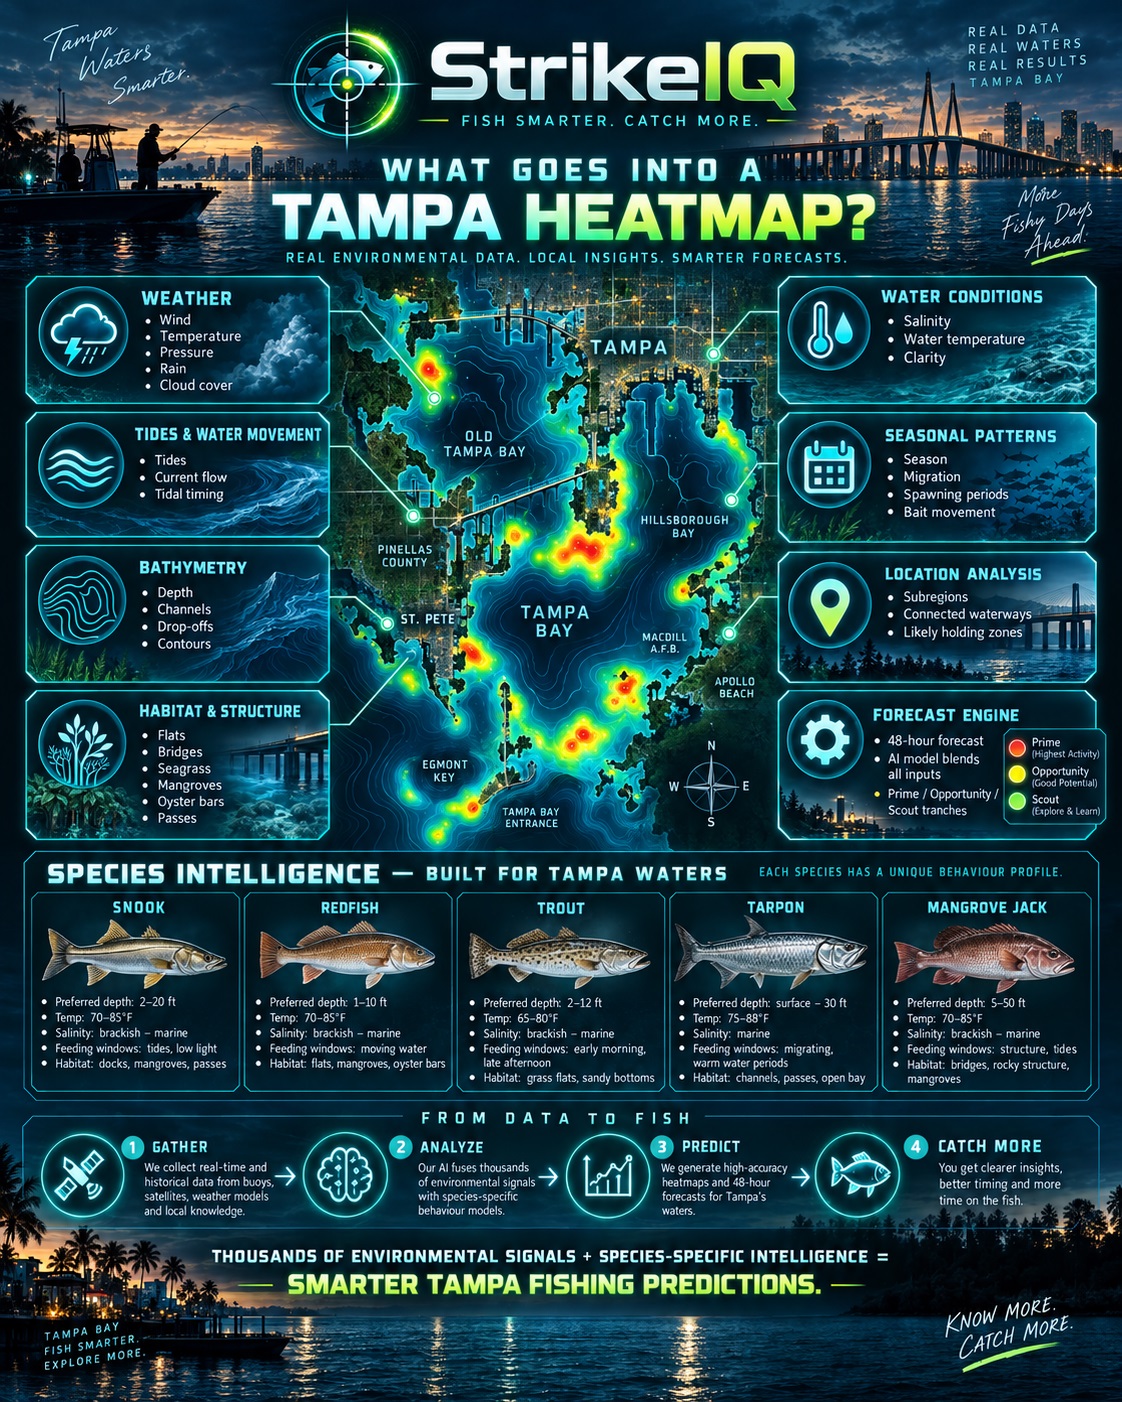
Beneath the BiteMap How StrikeIQ builds Tampa Bay’s fishing heatmaps
A grass edge, a mangrove shoreline and a channel shoulder can sit close together in Tampa Bay and offer very different fishing opportunities. Add changing water levels, current, temperature and the species you are targeting, and the picture becomes more interesting still. StrikeIQ’s BiteMap brings those layers together. Its Tampa forecasts combine mapped underwater terrain and habitat with environmental forecasts and species-specific rules, helping you choose where to investigate and when. The detail comes from connecting the shape of the bay to the conditions moving through it.
The foundation: the shape of the bay
We start with the physical setting. Within the approved survey footprint, Tampa’s depth evidence uses verified tiles from the 2022 University of South Florida bathymetric lidar dataset, distributed through NOAA. Collected by Fugro, this coastal survey provides a digital elevation model with two-metre grid spacing. It gives us a detailed foundation for examining underwater terrain where valid survey data exists.
Terrain matters because fish respond to more than a depth number. A flat beside a channel, a drop-off, a deeper pocket and a channel shoulder each create a different setting. StrikeIQ’s regional preparation identifies these kinds of features and carries them into the habitat and species assessment.
Two-metre grid spacing describes the source map. It does not mean fish can be predicted to within two metres, or that every part of Tampa Bay has the same survey coverage. The lidar dataset contains gaps, and unsupported depths stay unknown. For eligible surveyed areas, StrikeIQ applies a scoped, provisional conversion to a common tidal reference and reduces the weight of that depth evidence to reflect its uncertainty.
Grass, mangroves, oysters and structure
Depth becomes more useful when it is connected to habitat. Tampa’s prepared mapping includes seagrass, mangroves and oyster habitat, alongside eligible bridge, reef, marina and inlet records. These layers give the model information about the surroundings of a candidate fishing location.
The species profiles then interpret that setting differently. Red drum and spotted seatrout have strong relationships with flats, grass and nearby channels in the regional model. Common snook profiles give weight to mangrove edges, structure and current-related features. Sheepshead favour a different combination of structure and oyster habitat, while gag grouper profiles emphasise features such as reefs and deeper terrain.
The geometry of each source also matters. A mapped seagrass polygon can describe a habitat boundary. A marina point identifies a location without proving the shape of every dock. Bridge lines do not identify every individual piling. Preserving those distinctions helps the model use the detail the source actually supports.
Adding the moving water
The seabed changes slowly; the water above it can change within a fishing session. StrikeIQ uses NOAA’s Tampa Bay Operational Forecast System, or TBOFS, as its regional ocean-model source. TBOFS provides forecasts of water level, currents, temperature and salinity. Together, these describe important parts of the conditions a location may experience.
StrikeIQ prepares the model’s current components so their direction corresponds to geographic east and north before deriving current speed and direction. That processing matters: a model grid has its own orientation, and a useful fishing forecast must interpret flow in the real geography of the bay.
Tide information from NOAA CO-OPS and weather from the National Weather Service’s Tampa Bay office add further context. Tide height and current are related, but they answer different questions: how much water is present, and how that water is moving. Combining them helps the model assess both water access over a feature and its environmental activation.
A forecast built around your target species
Tampa’s current forecast package supports 13 target species, including snook, red drum, spotted seatrout, tarpon, sheepshead and several nearshore predators. Each is assessed through its own regional profile. A location that ranks well for one target does not automatically deserve the same ranking for another.
The opportunity engine brings together habitat suitability, tide-adjusted depth and water access, environmental activation, feeding or movement potential, and species behaviour. Its forecast packages contain 48 directly sourced hourly steps, allowing the assessment to change as the environmental forecast changes. A location’s value is therefore tied to both a species and an hour.
Consider a mapped grass edge beside a channel. Its habitat and terrain provide the starting point. The model then evaluates the available water and environmental conditions against the selected species profile. A different hour or target can change its ranking. This is an illustration of how the assessment works, rather than a claim that fish have been observed at that spot.
Keeping the heatmap connected to real water
A useful map must respect shorelines, islands and connected waterways. StrikeIQ checks candidate locations against approved water geometry and regional boundaries before they become eligible opportunities. Habitat and terrain information then help distinguish places within that eligible water.
The Tampa selection process also distributes eligible opportunities across connected parts of the region and limits duplicated locations. This makes the displayed map more useful for planning across the bay while preserving the underlying evidence requirements. More coloured points alone would not make a better fishing forecast.
What “Prime” tells you
Prime identifies the strongest currently valid, evidence-backed locations for the selected species and forecast hour. It is a relative opportunity ranking, separate from the confidence attached to the underlying evidence. It is not a percentage chance of catching a fish.
Missing environmental inputs do not receive invented positive evidence. That matters for variables such as runoff, water quality and harmful algal blooms: a source appearing in a regional data plan does not establish that a usable live feed is available. The model uses supported inputs and retains explicit limitations where evidence is missing.
Turn the detail into a better starting point
Tampa’s BiteMap is designed to narrow the search: identify promising combinations of habitat, terrain and forecast conditions, then use your observations on the water to refine the decision. Bait activity, water clarity and the actual conditions you encounter remain valuable checks.
These heatmaps are fishing intelligence, not navigation charts or permission to fish or harvest. Their practical value is a more informed starting point for your next session.
Explore Tampa in StrikeIQ on web, Android and iOS at strikeiq.fish/install Choose your target, compare the forecast hours and investigate the places where habitat and conditions come together.