Beneath the BiteMap How StrikeIQ builds Puget Sound’s fishing heatmaps
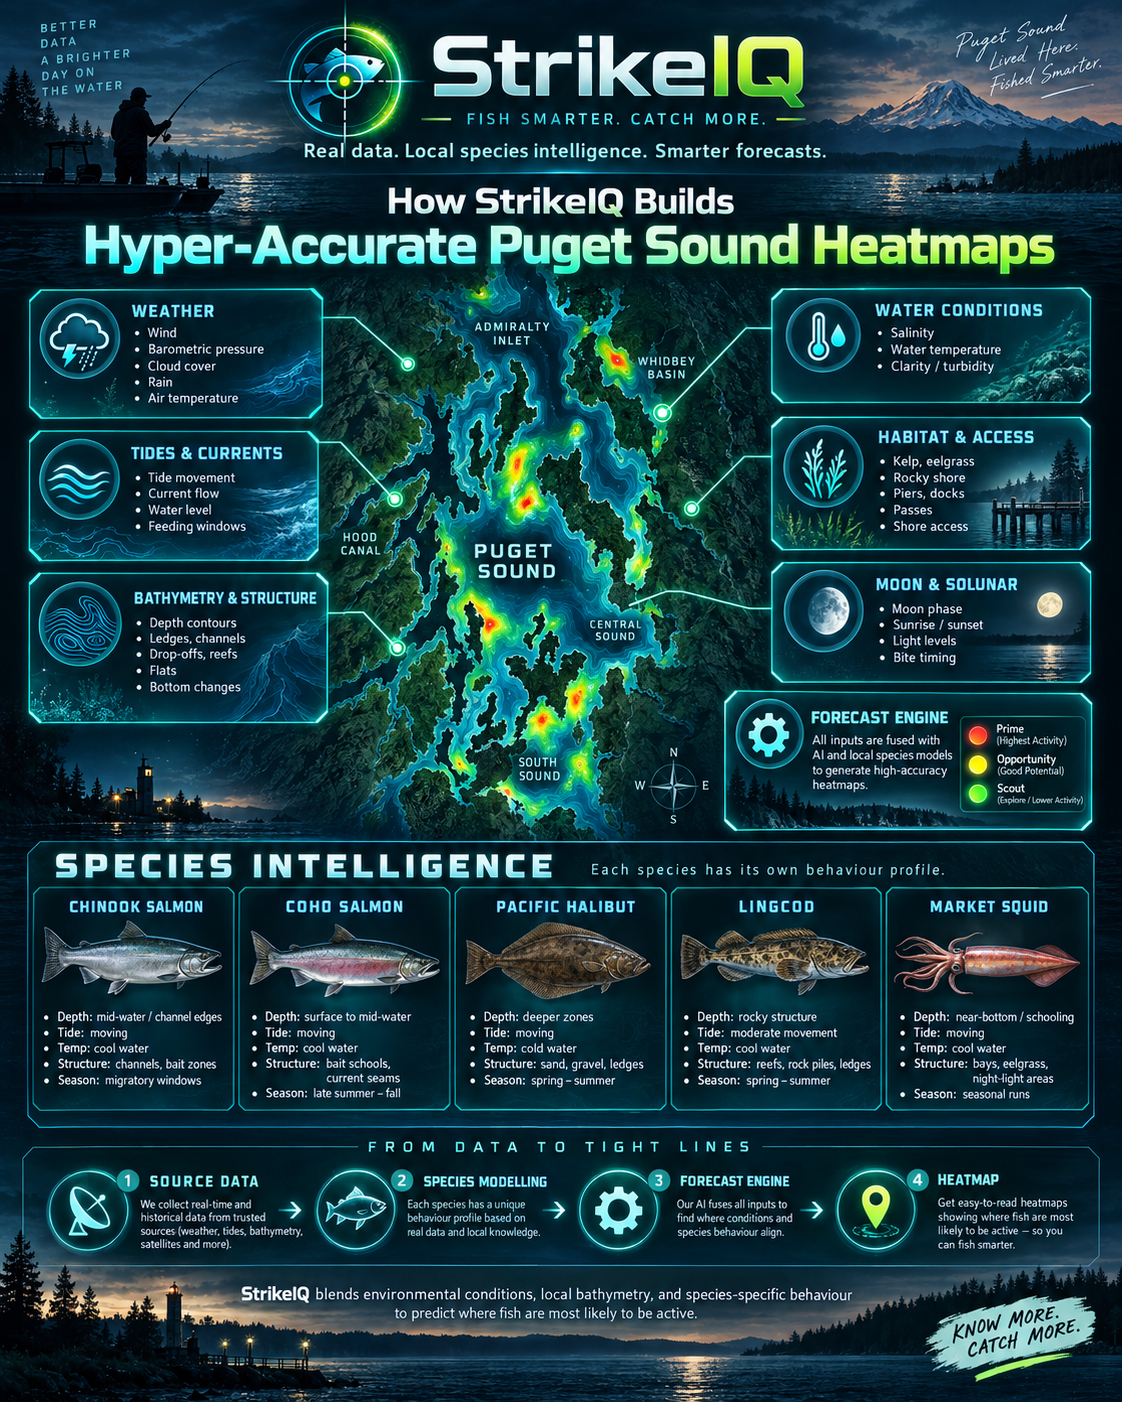
Puget Sound’s underwater landscape is a network of deep basins, narrow passages, shelves and steep edges. A kelp-fringed shoreline and a channel only a short distance away can present very different opportunities. The surface tells only part of the story. StrikeIQ’s Puget Sound BiteMap brings that underwater landscape together with habitat records, surface and bottom ocean forecasts, and regional species profiles. The result is a changing assessment of where the available evidence points to stronger fishing opportunities for your chosen target.
A detailed model of the underwater landscape
The physical foundation is the USGS Coastal National Elevation Database, known as CoNED. Its Puget Sound topobathymetric model combines land elevation and underwater terrain on a one-metre grid, drawing on source material spanning 1887 to 2017. It provides the terrain framework for identifying features such as channels, shoulders, ledges and changes in slope.
That one-metre grid is useful detail, but it is not a promise of one-metre survey accuracy everywhere. The underlying surveys differ in age and quality. StrikeIQ retains source information and confidence rather than treating every cell as equally certain.
Water depth also needs a consistent reference. The Puget implementation uses CoNED bathymetry converted to Mean Lower Low Water, the tidal reference used by the approved scoring dataset. Washington’s Department of Natural Resources provides the derived MLLW service. Bringing seabed elevations and tidal information onto compatible references supports an assessment of the water over a feature at a particular hour.
Kelp, eelgrass and the food-web context
Underwater shape becomes more informative when habitat is added. StrikeIQ’s Puget preparation includes Washington DNR ShoreZone records for kelp, eelgrass and substrate. It also includes Washington Department of Fish and Wildlife forage-fish spawning records and herring spawning and holding areas. These layers provide different kinds of ecological context around a candidate location.
A kelp observation can support a habitat association. A mapped herring holding area can inform a predator profile’s feeding or movement assessment. Neither establishes that kelp remains unchanged today or that a bait school is present right now. These are mapped habitat relationships, not live observations of fish.
That distinction also applies to gaps. An area without a mapped habitat record is not automatically an area without habitat. Source coverage and observation history remain part of the evidence, so missing mapping does not become a confident statement about what is absent.
Forecasting the surface and the water below
Puget Sound’s ocean forecasts come from NOAA’s Salish Sea and Columbia River Operational Forecast System, or SSCOFS. This three-dimensional system models water levels, currents, temperature and salinity across its domain. It provides the changing environmental foundation for StrikeIQ’s Puget forecasts.
StrikeIQ uses 48 consecutive, directly sourced forecast hours from a complete model cycle. Candidate locations are associated with the ocean-model mesh, and the current implementation carries both surface and bottom current, temperature and salinity evidence. This allows the assessment to distinguish conditions near the surface from those near the seabed.
That distinction is especially useful in a deep, complex region. A bottom-associated target and a fish moving through upper-water habitat should not automatically receive an identical environmental assessment. The model interprets the available conditions through the selected species profile.
Fine seabed mapping and ocean-model forecasts operate at different scales. Combining them gives each location environmental context; it does not create a direct measurement of the current beside every rock or dock. The displayed detail should always be understood alongside the resolution and confidence of its sources. Local tides, weather and seven connected systems NOAA CO-OPS tide predictions and forecasts from the National Weather Service’s Seattle office provide additional local context. The tide series describes changing water level, while the ocean model describes the movement and properties of the water. Both are useful, and they are kept distinct in the data preparation.
Puget Sound is also divided into seven ecological subregions for the regional profiles: the northern and Deception Pass area, Admiralty Inlet, Whidbey Basin, central Puget Sound, Tacoma and Vashon, southern Puget Sound, and Hood Canal. This allows seasonal and habitat relationships to reflect more than a single region-wide average.
Approved water geometry helps keep candidate opportunities inside the supported waterways. Land boundaries and regional identity are checked independently of depth: a negative elevation alone is not proof that a point belongs in the fishing forecast.
Fourteen targets, different relationships
The current Puget selector supports 14 targets, from salmon and coastal cutthroat trout to halibut, lingcod, bottomfish and market squid. Each has its own regional profile. The selector is a set of supported targets; it does not mean every target will have available opportunities in every season or forecast hour.
For example, the Chinook profile combines channel and deeper-terrain relationships with relevant forage habitat. The coho profile places different emphasis on current edges, channel shoulders, kelp and feeding context. These relationships help the model ask a species-specific question about the same water. They remain modelled ecological assumptions that can be reviewed and refined.
The scoring engine combines habitat suitability, tide-adjusted depth and water access, environmental activation, feeding or movement potential, and species behaviour. Seasonal, lifecycle and applicable targeting constraints can also make an opportunity unavailable. An explicit unavailable result is different from a claim that no fish exist there.
What makes the heatmap realistic?
The realism comes from agreement between layers: a location must belong to eligible water, its terrain and habitat must make sense for the target, and its available environmental evidence must support the assessment. Colour is the presentation of that assessment, rather than evidence by itself.
Prime marks the strongest currently valid, evidence-backed locations for the selected species and hour. That relative display rank is kept separate from scientific confidence and is not a numerical probability of catching a fish. Missing optional environmental inputs contribute no positive evidence.
Puget Sound is a public-beta forecast region. Its profiles and predictions are still being refined, and a detailed map does not remove uncertainty in older surveys, habitat observations or future conditions. That is why source quality and availability remain part of the model.
Use the forecast to focus your next session
Choose your target, compare the forecast hours and look for the combination of terrain, habitat and conditions that suits your trip. Then check that picture against what you see on the water. StrikeIQ is designed to make that search more informed.
Heatmaps are fishing intelligence, not navigation charts or a substitute for current fishing rules. They help identify places worth investigating within the limits of the available evidence. Explore Puget Sound in StrikeIQ on web, Android and iOS at strikeiq.fish/install , and see how the underwater landscape and forecast conditions shape the next opportunity.